Note
Go to the end to download the full example code or to run this example in your browser via Binder
aac pdp
import os
from typing import Callable

import numpy as np
import pandas as pd
import seaborn as sns
import matplotlib.pyplot as plt

from ai4water.postprocessing.explain._partial_dependence import (compute_bounds,
    _add_dist_as_grid, process_axis)
from ai4water.postprocessing import PartialDependencePlot

from aac_utils import get_fitted_model, aac_data
model = get_fitted_model()
********** Removing Examples with nan in labels  **********

***** Training *****
input_x shape:  (374, 6)
target shape:  (374, 1)
x, _, _, _ = aac_data()
********** Removing Examples with nan in labels  **********

***** Training *****
input_x shape:  (374, 6)
target shape:  (374, 1)
class PartialDependencePlot1(PartialDependencePlot):

    def __init__(
            self,
            model: Callable,
            data,
            feature_names=None,
            num_points: int = 100,
            path=None,
            save: bool = True,
            show: bool = True,
            **kwargs
    ):
        """Initiates the class
        Parameters
        ----------
            model : Callable
                the trained/calibrated model which must be callable. It must take the
                `data` as input and sprout an array of predicted values. For example
                if you are using Keras/sklearn model, then you must pass model.predict
            data : np.ndarray, pd.DataFrame
                The inputs to the `model`. It can numpy array or pandas DataFrame.
            feature_names : list, optional
                Names of features. Used for labeling.
            num_points : int, optional
                determines the grid for evaluation of `model`
            path : str, optional
                path to save the plots. By default the results are saved in current directory
            show:
                whether to show the plot or not
            save:
                whether to save the plot or not
            **kwargs :
                any additional keyword arguments for `model`
        """

        self.model = model
        self.num_points = num_points
        self.xmin = "percentile(0)"
        self.xmax = "percentile(100)"
        self.kwargs = kwargs

        if isinstance(data, pd.DataFrame):
            if feature_names is None:
                feature_names = data.columns.tolist()
            data = data.values

        if not os.path.exists(path):
            os.makedirs(path)

        self.path = path
        self.data = data
        self.features = feature_names
        self.save = save
        self.show = show

    @property
    def data_is_2d(self):
        if isinstance(self.data, np.ndarray) and self.data.ndim == 2:
            return True
        elif isinstance(self.data, pd.DataFrame):
            return True
        else:
            return False

    @property
    def data_is_3d(self):
        if isinstance(self.data, np.ndarray) and self.data.ndim == 3:
            return True
        return False

    @property
    def single_source(self):
        if isinstance(self.data, list) and len(self.data) > 1:
            return False
        else:
            return True

    @property
    def features(self):
        return self._features

    @features.setter
    def features(self, features):
        if self.data_is_2d:
            if type(self.data) == pd.DataFrame:

                features = self.data.columns.to_list()
            elif features is None:
                features = [f"Feature {i}" for i in range(self.data.shape[-1])]
            else:
                assert isinstance(features, list) and len(features) == self.data.shape[-1], f"""
                    features must be given as list of length {self.data.shape[-1]}
                    but are of len {len(features)}
                    """

                features = features
        elif not self.single_source and features is None:
            features = []
            for data in self.data:
                if isinstance(data, pd.DataFrame):
                    _features = data.columns.to_list()
                else:
                    _features = [f"Feature {i}" for i in range(data.shape[-1])]

                features.append(_features)

        elif self.data_is_3d and features is None:
            features = [f"Feature {i}" for i in range(self.data.shape[-1])]

        self._features = features

    def plot_1d(
            self,
            feature,
            show_dist: bool = True,
            show_dist_as: str = "hist",
            ice: bool = True,
            feature_expected_value: bool = False,
            model_expected_value: bool = False,
            show_ci: bool = False,
            show_minima: bool = False,
            ice_only: bool = False,
            ice_color: str = "lightblue",
            ices_to_remove=None,
            ice_linewidth=None,
    ):
        """partial dependence plot in one dimension
        Parameters
        ----------
            feature :
                the feature name for which to plot the partial dependence
            show_dist :
                whether to show actual distribution of data or not
            show_dist_as :
                one of "hist" or "grid"
            ice :
                whether to show individual component elements on plot or not
            feature_expected_value :
                whether to show the average value of feature on the plot or not
            model_expected_value :
                whether to show average prediction on plot or not
            show_ci :
                whether to show confidence interval of pdp or not
            show_minima :
                whether to indicate the minima or not
            ice_only : bool, False
                whether to show only ice plots
            ice_color :
                color for ice lines. It can also be a valid maplotlib
                `colormap <https://matplotlib.org/3.5.1/tutorials/colors/colormaps.html>`_
        """
        if isinstance(feature, list) or isinstance(feature, tuple):
            raise NotImplementedError
        else:
            if self.single_source:
                if self.data_is_2d:
                    ax = self._plot_pdp_1dim(
                        *self._pdp_for_2d(self.data, feature),
                        self.data, feature,
                        show_dist=show_dist,
                        show_dist_as=show_dist_as,
                        ice=ice,
                        feature_expected_value=feature_expected_value,
                        show_ci=show_ci, show_minima=show_minima,
                        model_expected_value=model_expected_value,
                        show=self.show,
                        save=self.save,
                        ice_only=ice_only,
                        ice_color=ice_color,
                        ices_to_remove=ices_to_remove,
                        ice_linewidth=ice_linewidth,
                    )
                elif self.data_is_3d:
                    for lb in range(self.data.shape[1]):
                        ax = self._plot_pdp_1dim(
                            *self._pdp_for_2d(self.data, feature, lb),
                            data=self.data,
                            feature=feature,
                            lookback=lb,
                            show_ci=show_ci,
                            show_minima=show_minima,
                            show_dist=show_dist,
                            show_dist_as=show_dist_as,
                            ice=ice,
                            feature_expected_value=feature_expected_value,
                            model_expected_value=model_expected_value,
                            show=self.show,
                            save=self.save,
                            ice_only=ice_only,
                            ice_color=ice_color)
                else:
                    raise ValueError(f"invalid data shape {self.data.shape}")
            else:
                for data in self.data:
                    if self.data_is_2d:
                        ax = self._pdp_for_2d(data, feature)
                    else:
                        for lb in []:
                            ax = self._pdp_for_2d(data, feature, lb)
        return ax

    def _plot_pdp_1dim(
            self,
            pd_vals, ice_vals, data, feature,
            lookback=None,
            show_dist=True, show_dist_as="hist",
            ice=True, show_ci=False,
            show_minima=False,
            feature_expected_value=False,
            model_expected_value=False,
            show=True, save=False, ax=None,
            ice_color="lightblue",
            ice_only=False,
            ices_to_remove:list = None,
            ice_linewidth=None,
    ):

        xmin, xmax = compute_bounds(self.xmin,
                                    self.xmax,
                                    self.xv(data, feature, lookback))

        if ax is None:
            fig = plt.figure()
            ax = fig.add_axes((0.1, 0.3, 0.8, 0.6))

        xs = self.grid(data, feature, lookback)

        ylabel = "E[f(x) | " + feature + "]"
        if ice:
            n = ice_vals.shape[1]
            if ice_color in plt.colormaps():
                colors = plt.get_cmap(ice_color)(np.linspace(0, 0.8, n))
            elif hasattr(ice_color, '__len__') and not isinstance(ice_color, str):
                assert len(ice_color) == n, f"{len(ice_color)}"
                colors = ice_color
            else:
                colors = [ice_color for _ in range(n)]

            if ices_to_remove is None:
                ices_to_remove = []

            if ice_linewidth is None:
                ice_linewidth = min(1, 50 / n)  # pylint: disable=unsubscriptable-object
            for ice_idx in range(n):

                if ice_idx not in ices_to_remove:

                    ax.plot(xs, ice_vals[:, ice_idx], color=colors[ice_idx],
                        linewidth=ice_linewidth, alpha=1)
            ylabel = "f(x) | " + feature

        if show_ci:
            std = np.std(ice_vals, axis=1)
            upper = pd_vals + std
            lower = pd_vals - std
            color = '#66C2D7'
            if ice_color != "lightblue":
                if ice_color not in plt.colormaps():
                    color = ice_color

            ax.fill_between(xs, upper, lower, alpha=0.14, color=color)

        # the line plot
        if not ice_only:
            ax.plot(xs, pd_vals, color='blue', linewidth=2, alpha=1)

        title = None
        if lookback is not None:
            title = f"lookback: {lookback}"
        process_axis(ax,
                     ylabel=ylabel,
                     ylabel_kws=dict(fontsize=20),
                     right_spine=False,
                     top_spine=False,
                     tick_params=dict(labelsize=11),
                     xlabel=feature,
                     xlabel_kws=dict(fontsize=20),
                     title=title)
        ax.xaxis.set_ticks_position('bottom')
        ax.yaxis.set_ticks_position('left')

        ax2 = ax.twinx()

        if show_dist:
            xv = self.xv(data, feature, lookback)
            if show_dist_as == "hist":

                ax2.hist(xv, 50, density=False, facecolor='black', alpha=0.1,
                         range=(xmin, xmax))
            else:
                _add_dist_as_grid(fig, xv, other_axes=ax, xlabel=feature,
                                  xlabel_kws=dict(fontsize=20))

        process_axis(ax2,
                     right_spine=False,
                     top_spine=False,
                     left_spine=False,
                     bottom_spine=False,
                     ylim=(0, data.shape[0]))
        ax2.xaxis.set_ticks_position('bottom')
        ax2.yaxis.set_ticks_position('left')
        ax2.yaxis.set_ticks([])

        if feature_expected_value:
            self._add_feature_exp_val(ax2, ax, xmin, xmax, data, feature, lookback)

        if model_expected_value:
            self._add_model_exp_val(ax2, ax, data)

        if show_minima:
            minina = self.model(data, **self.kwargs).min()
            ax.axvline(minina, linestyle="--", color="r", lw=1)

        if save:
            lookback = lookback or ''
            fname = os.path.join(self.path, f"pdp_{feature}_{lookback}")
            plt.savefig(fname, bbox_inches="tight", dpi=400)

        if show:
            plt.show()

        return ax

    def _pdp_for_2d(self, data, feature, lookback=None):
        ind = self._feature_to_ind(feature)

        xs = self.grid(data, feature, lookback)

        data_temp = data.copy()

        # instead of calling the model for each num_point, prepare the data
        # stack it in 'data_all' and call the model only once
        total_samples = len(data) * self.num_points
        data_all = np.full((total_samples, *data.shape[1:]), np.nan)

        pd_vals = np.full(self.num_points, np.nan)
        ice_vals = np.full((self.num_points, data.shape[0]), np.nan)

        st, en = 0, len(data)
        for i in range(self.num_points):

            if data.ndim == 3:
                data_temp[:, lookback, ind] = xs[i]
            else:
                data_temp[:, ind] = xs[i]
                data_all[st:en] = data_temp

            st = en
            en += len(data)

        predictions = self.model(data_all, **self.kwargs)

        st, en = 0, len(data)
        for i in range(self.num_points):
            pred = predictions[st:en]
            pd_vals[i] = pred.mean()
            ice_vals[i, :] = pred.reshape(-1, )
            st = en
            en += len(data)

        return pd_vals, ice_vals
pdp = PartialDependencePlot1(
    model=model.predict,
    data=pd.DataFrame(x, columns=model.input_features),
    feature_names=model.input_features,
    num_points=100,
    save=False,
    path=model.path
)
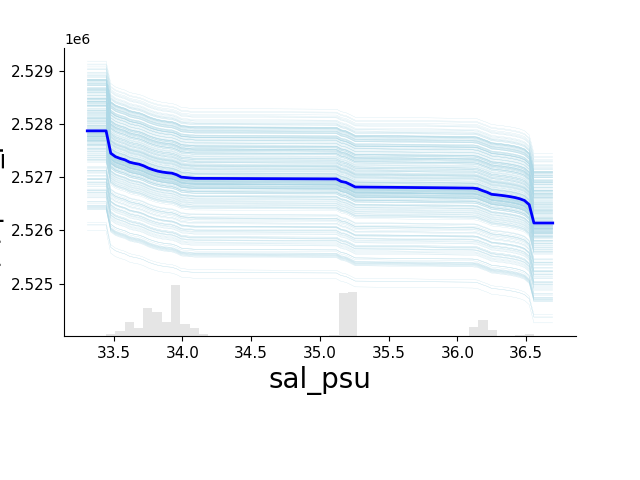
sal_psu
_ = pdp.plot_1d("sal_psu")
pdp.plot_1d("sal_psu", ice=False)
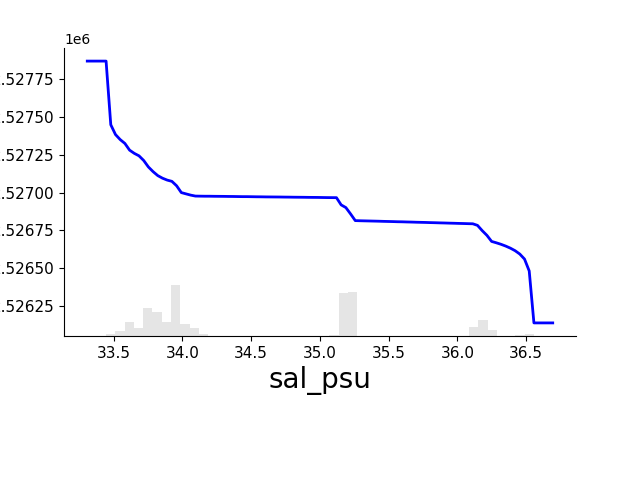
<Axes: xlabel='sal_psu', ylabel='E[f(x) | sal_psu]'>
pal = sns.color_palette("bright", n_colors=len(pdp.data))

pdp.plot_1d("sal_psu", ice_only=True, ice_color=pal, ice_linewidth=0.5)
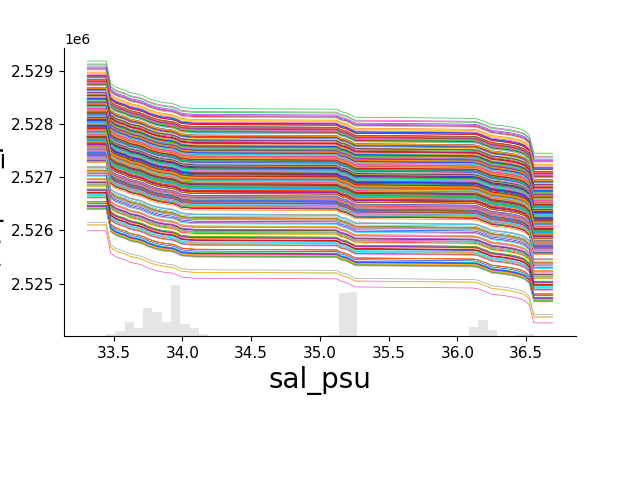
<Axes: xlabel='sal_psu', ylabel='f(x) | sal_psu'>
pdp.plot_1d("sal_psu", ice_only=True, ice_color=pal,
            ices_to_remove=[275], ice_linewidth=0.5)

<Axes: xlabel='sal_psu', ylabel='f(x) | sal_psu'>
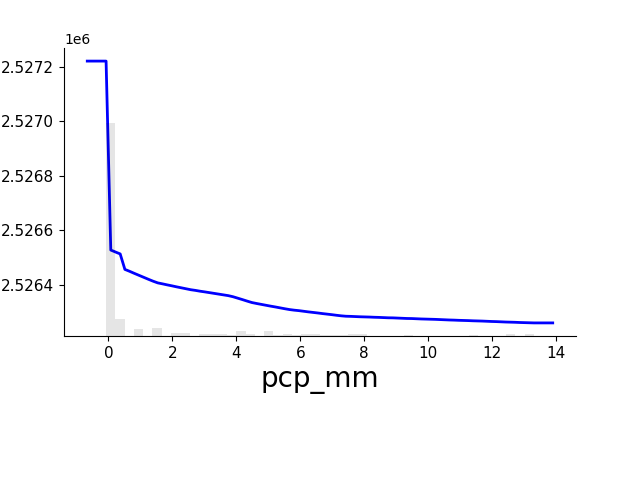
pcp_mm
_ = pdp.plot_1d("pcp_mm")

_ = pdp.plot_1d("pcp_mm", ice=False)
_ = pdp.plot_1d("pcp_mm", show_ci=False, ice_only=True, ice_color=pal,
                ice_linewidth=0.5)
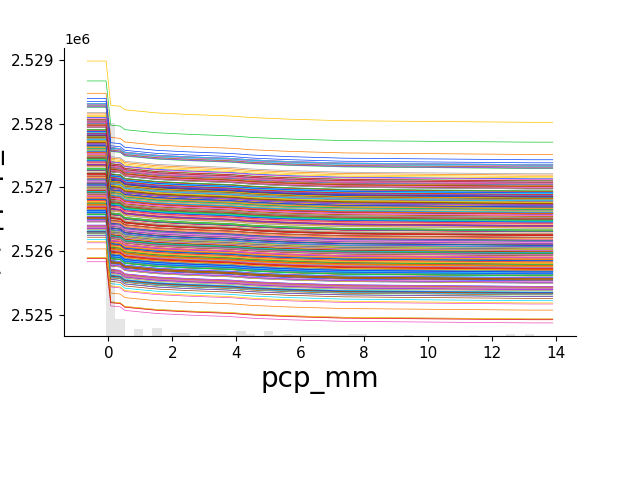
_ = pdp.plot_1d("pcp_mm", show_ci=False, ice_only=True, ice_color=pal,
                ice_linewidth=0.5, ices_to_remove=[275])

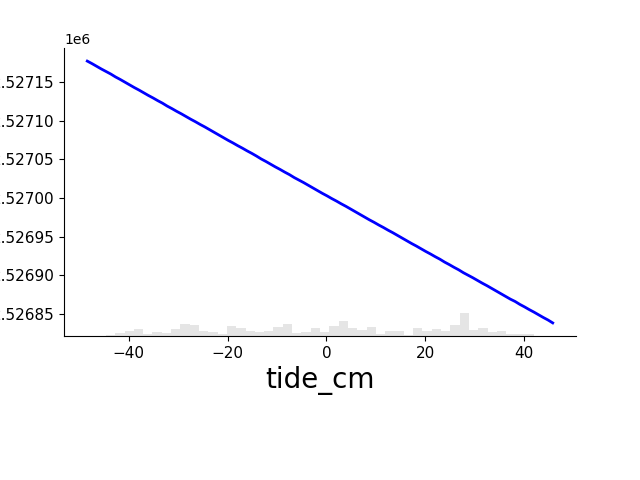
tide_cm
_ = pdp.plot_1d("tide_cm")

_ = pdp.plot_1d("tide_cm", ice=False)
_ = pdp.plot_1d("tide_cm", show_ci=False, ice_only=True,
                ice_color=pal, ice_linewidth=0.5)
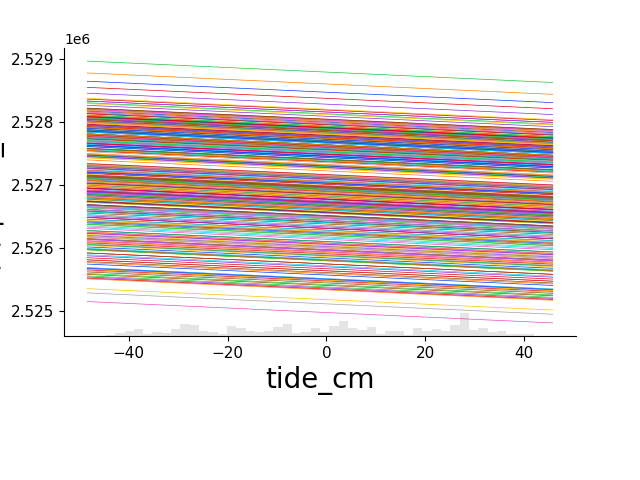
_ = pdp.plot_1d("tide_cm", show_ci=False, ice_only=True,
                ice_color=pal, ice_linewidth=0.5, ices_to_remove=[275])

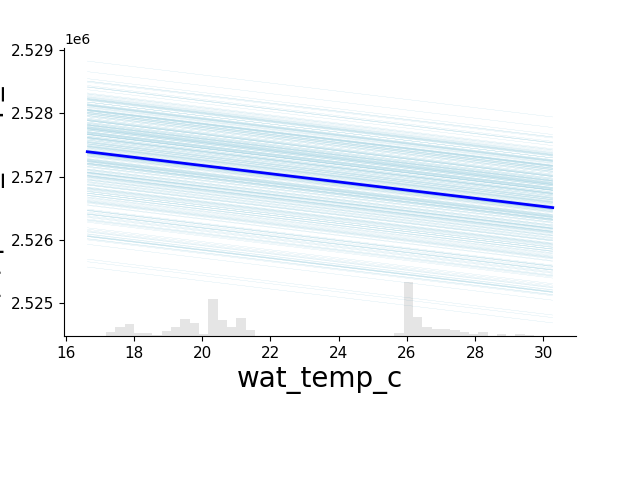
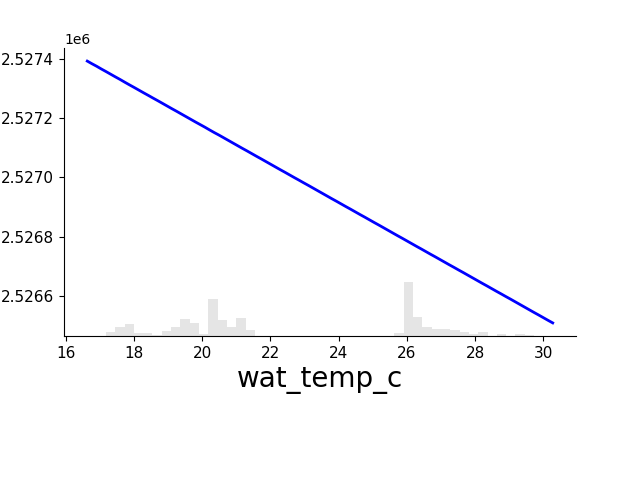
wat_temp_c
_ = pdp.plot_1d("wat_temp_c")
_ = pdp.plot_1d("wat_temp_c", ice=False)
_ = pdp.plot_1d("wat_temp_c", show_ci=False, ice_only=True,
                ice_color=pal, ice_linewidth=0.5)

_ = pdp.plot_1d("wat_temp_c", show_ci=False, ice_only=True,
                ice_color=pal, ice_linewidth=0.5, ices_to_remove=[275])

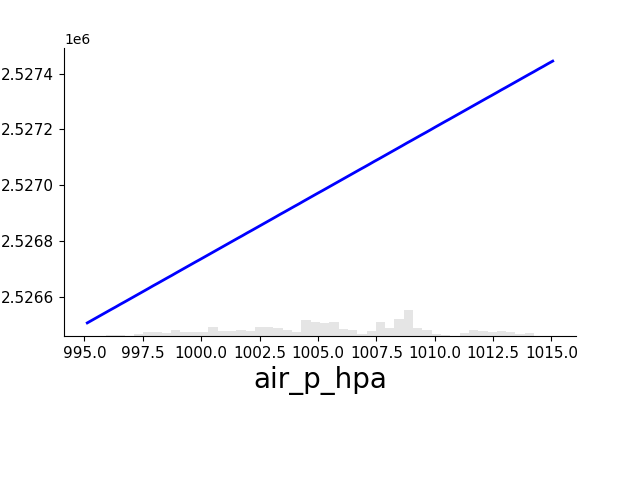
air_p_hpa
_ = pdp.plot_1d("air_p_hpa")

_ = pdp.plot_1d("air_p_hpa", ice=False)
_ = pdp.plot_1d("air_p_hpa", show_ci=False, ice_only=True,
                ice_color=pal, ice_linewidth=0.5)
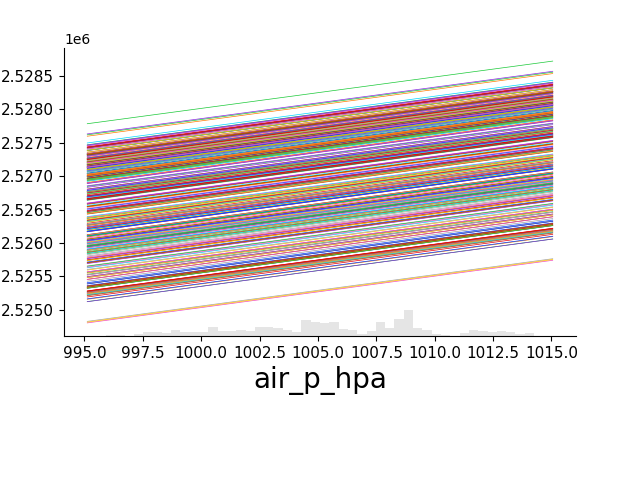
_ = pdp.plot_1d("air_p_hpa", show_ci=False, ice_only=True,
                ice_color=pal, ice_linewidth=0.5, ices_to_remove=[275])

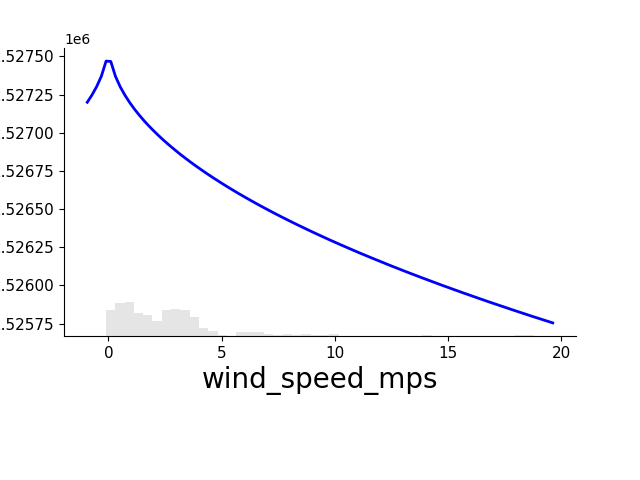
wind_speed_mps
_ = pdp.plot_1d("wind_speed_mps")

_ = pdp.plot_1d("wind_speed_mps", ice=False)
_ = pdp.plot_1d("wind_speed_mps", show_ci=False, ice_only=True,
                ice_color=pal, ice_linewidth=0.5)

_ = pdp.plot_1d("wind_speed_mps", show_ci=False, ice_only=True,
                ice_color=pal, ice_linewidth=0.5, ices_to_remove=[275])

## interaction
# _ = pdp.plot_interaction(["tide_cm", "pcp_mm"], cmap="Blues")
#
# #%%
#
# pdp.plot_interaction(["tide_cm", "wat_temp_c"], cmap="Blues")
#
# #%%
#
# pdp.plot_interaction(["tide_cm", "sal_psu"], cmap="Blues")
#
# #%%
#
# pdp.plot_interaction(["pcp_mm", "wat_temp_c"], cmap="Blues")
#
# #%%
#
# pdp.plot_interaction(["pcp_mm", "sal_psu"], cmap="Blues")
#
# #%%
#
# pdp.plot_interaction(["wat_temp_c", "sal_psu"], cmap="Blues")
#
# #%%
#
# _ = pdp.nd_interactions()
Total running time of the script: ( 0 minutes 20.194 seconds)